hello i was wondering if anyone has tried graphing the results of sudokus in a way that we can find a pattern or relationship. this is for a math fair project, and so far i have no luck in finding any relationships.
also is there any other area of sudoku a high school student can explore and obtain sufficient information for a math fair? thanks
graphing results of sudokus
3 posts
• Page 1 of 1
graphing results of sudokus
![]() by qwerty » Thu Jan 26, 2006 1:14 am
by qwerty » Thu Jan 26, 2006 1:14 am
- qwerty
- Posts: 4
- Joined: 06 December 2005
![]() by Moschopulus » Thu Jan 26, 2006 1:42 am
by Moschopulus » Thu Jan 26, 2006 1:42 am
Depends what you mean by a graph. You could try studying unavoidable sets, and the distribution of MCNs. See this post which has a graph
http://forum.enjoysudoku.com/viewtopic.php?t=605&postdays=0&postorder=asc&start=315
and lots of others on the minimum clues thread.
http://forum.enjoysudoku.com/viewtopic.php?t=605&postdays=0&postorder=asc&start=315
and lots of others on the minimum clues thread.
- Moschopulus
- Posts: 256
- Joined: 16 July 2005
![]() by olimpia » Mon Mar 16, 2009 6:59 am
by olimpia » Mon Mar 16, 2009 6:59 am
Is this anything like you're asking about?:
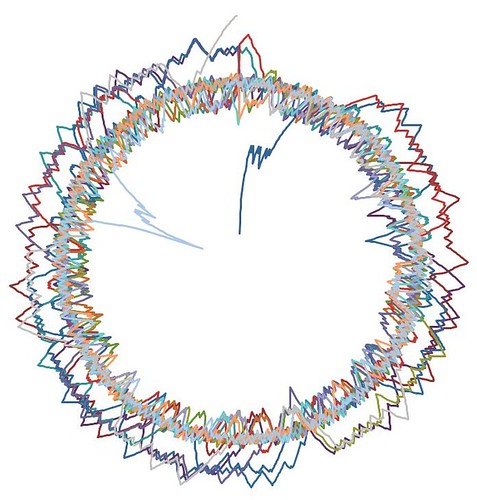
This is posted on flickr. All pictures on flickr should include a link so you can go to it here:
http://www.flickr.com/photos/npcomplete/2361922699/
The image represents the workings of:
I have also wondered if anyone can use the mathematics of sudoku to make anything like the images that come from fractals
(sorry I'm so late to reply. I hope you didn't get an F on your math project)
This is posted on flickr. All pictures on flickr should include a link so you can go to it here:
http://www.flickr.com/photos/npcomplete/2361922699/
The image represents the workings of:
- Code: Select all
1 . . 8 . 5 . . 4
. 2 . . 6 . . 9 .
. . . . . . . . .
8 . . . . . . . 6
. 6 . . . . . 2 .
4 . . . . . . . 5
. . . . . . . . .
. 1 . . 9 . . 6 .
5 . . 4 . 7 . . 8
I have also wondered if anyone can use the mathematics of sudoku to make anything like the images that come from fractals
(sorry I'm so late to reply. I hope you didn't get an F on your math project)
- olimpia
- Posts: 35
- Joined: 14 November 2008
- Location: USA
3 posts
• Page 1 of 1
